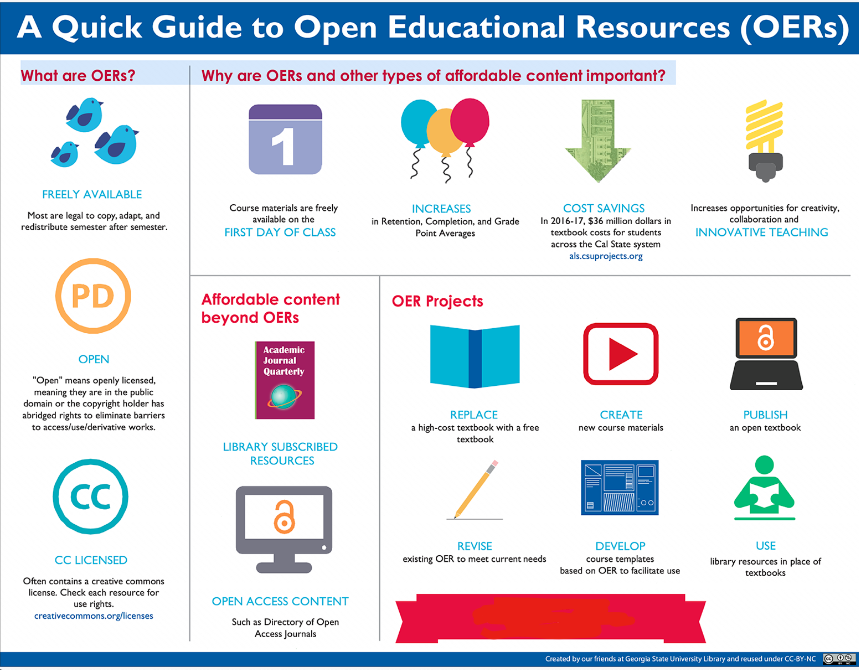
This is an infographic concerning OER and it is too complex to describe in an alt-text field. However you don’t want to leave the alt-text field completely blank, because then only sighted individuals would be able to understand the information in the image.
To make this complex infographic accessible a detailed transcript was created conveying all the information contained in the image and then within the alt-text field a note was placed reading: See transcript – “Quick Guide to Open Educational Resources (OERs)”
. Attribution: [Georgia State University] (n.d) Quick Guide to Open Educational Resources (OERs) infographic (CC_BY_NC license).

 .
.